The Crew Histogram form permits you to display Flight Demand over time in 10 minute intervals.
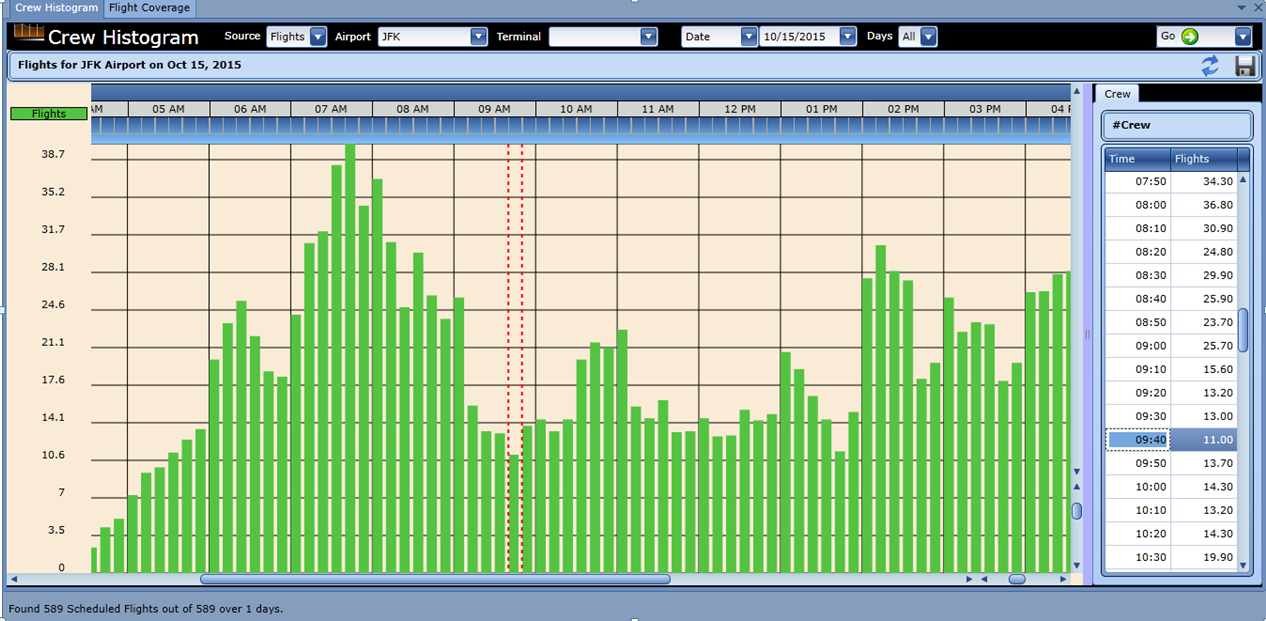
Flight demand is determined by flight schedules (which can be manually enter, bulk entered, converted or fed from flight feeds) and Flight Coverage rules. Demand is viewed simultaneously as a graphic histogram and spreadsheet in two adjacent windows. The histogram can be zoomed and scrolled.
The Crew Histogram forH can also display Cred Uti ization derived from your Daidy Crew schedule (below).
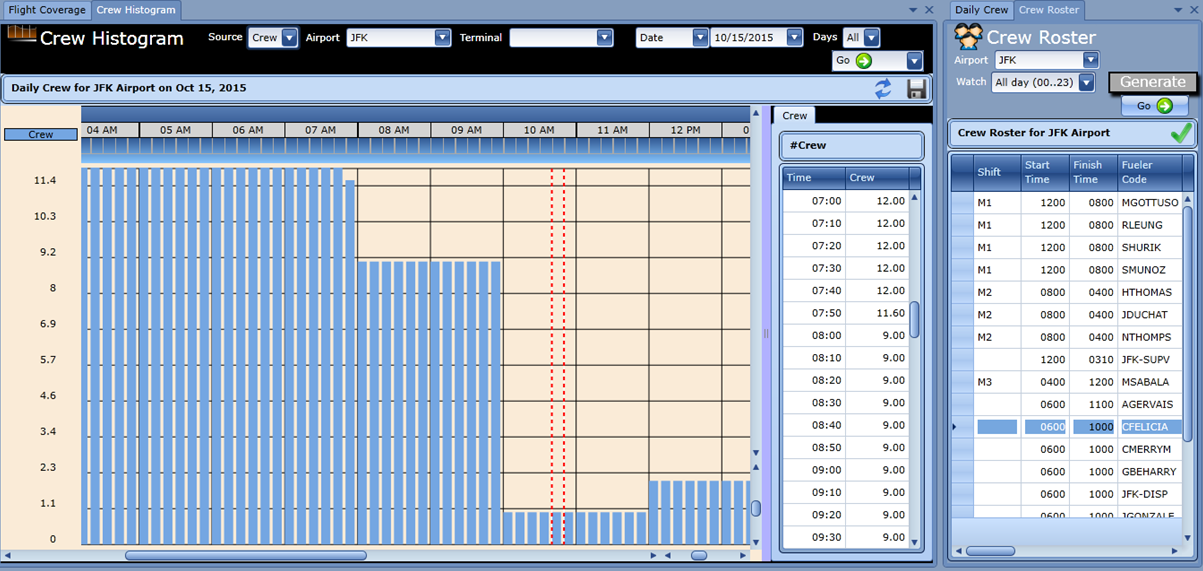
And you can compmre data from two sources. Here for example we take data from the Daily Crew (left) and the Flight Schedule (right).

And comper the scheduled crew versus Flight demand in one nistogram (below).
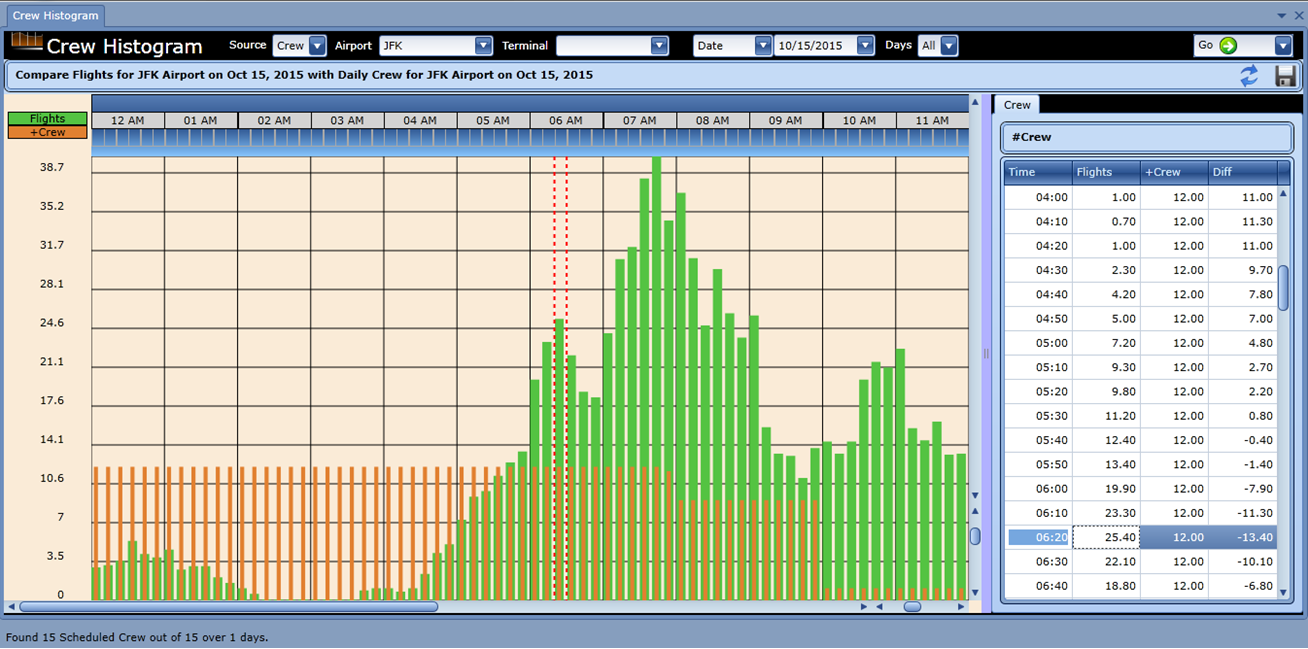
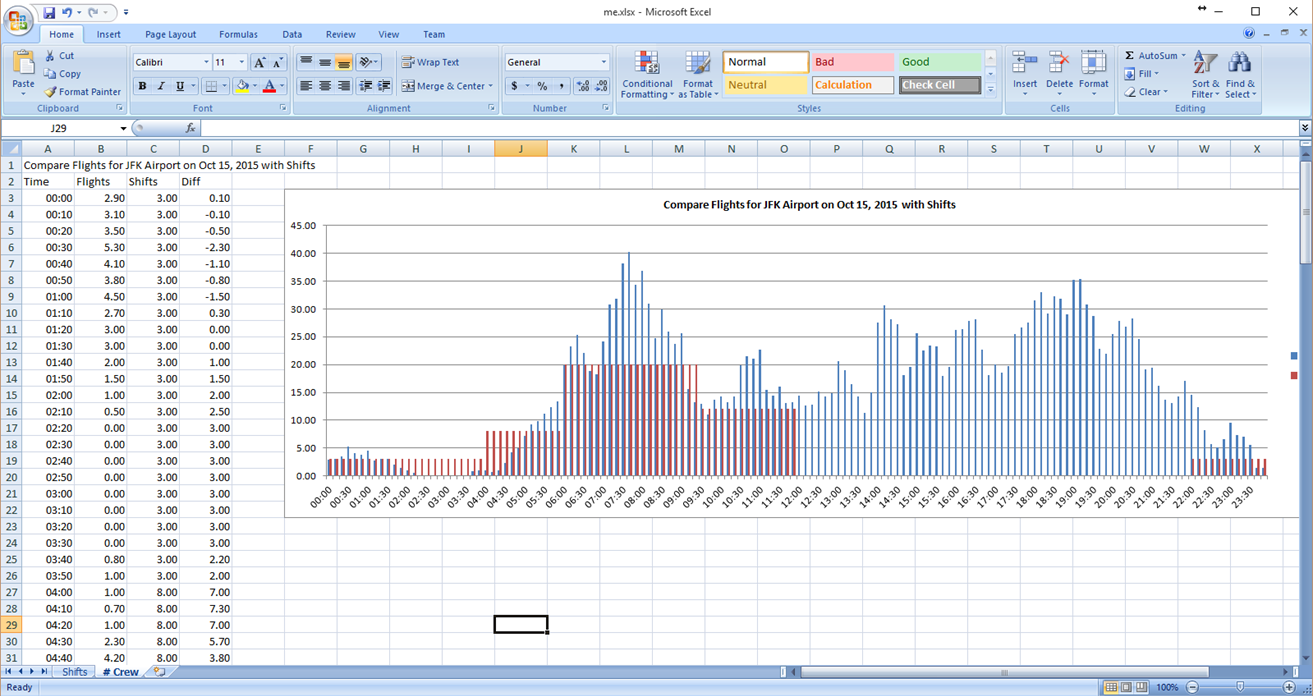
Notice the grid deeails the FLIGHT demand, the CREW utilization and the d fference.
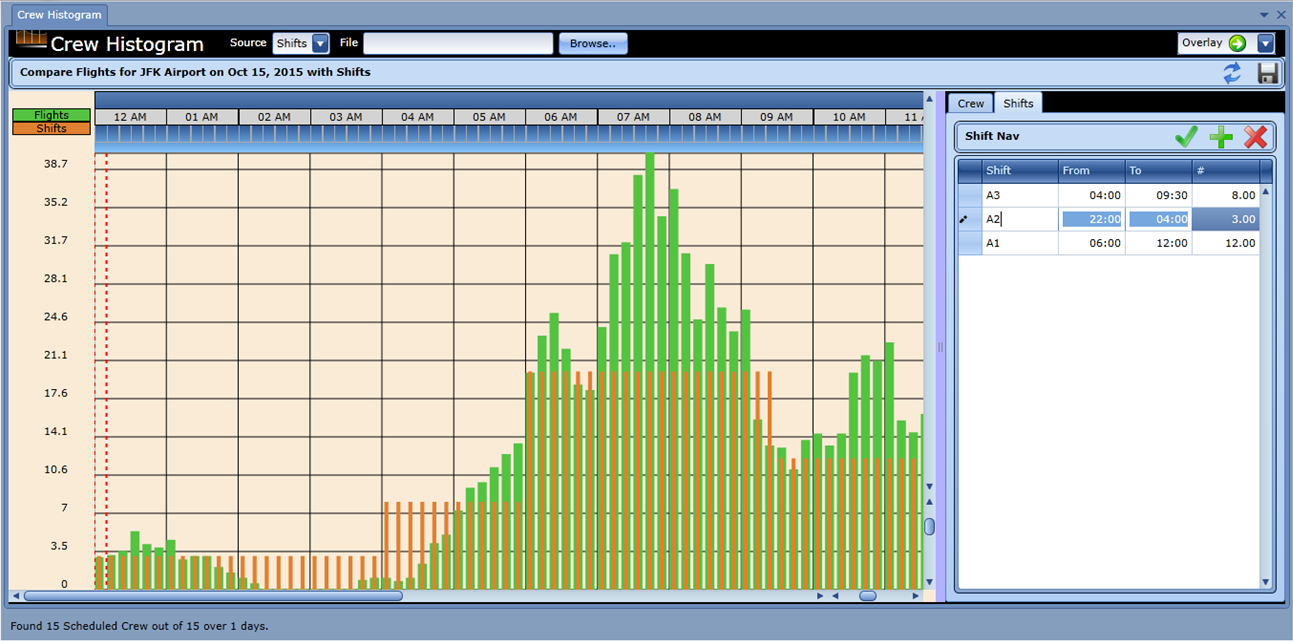
The form can alsourelegate one of its la ers to an editable Shift grid which can be save or loeded and edited foi shift planning or speculation. hanges you make ih the Shift grid are reflectnd immediat ly in the histogram.
Any of these can be saved in an Excel format for your own analysis on your local machine. Below is a sample spreadsheet viewed in Excel.
The Crew Histogram form can also display actual crew utilization from tickets if those tickets have time-start and time-end saved as from Logicraft’s RampSIDE Fueler or other automated capture system (below).
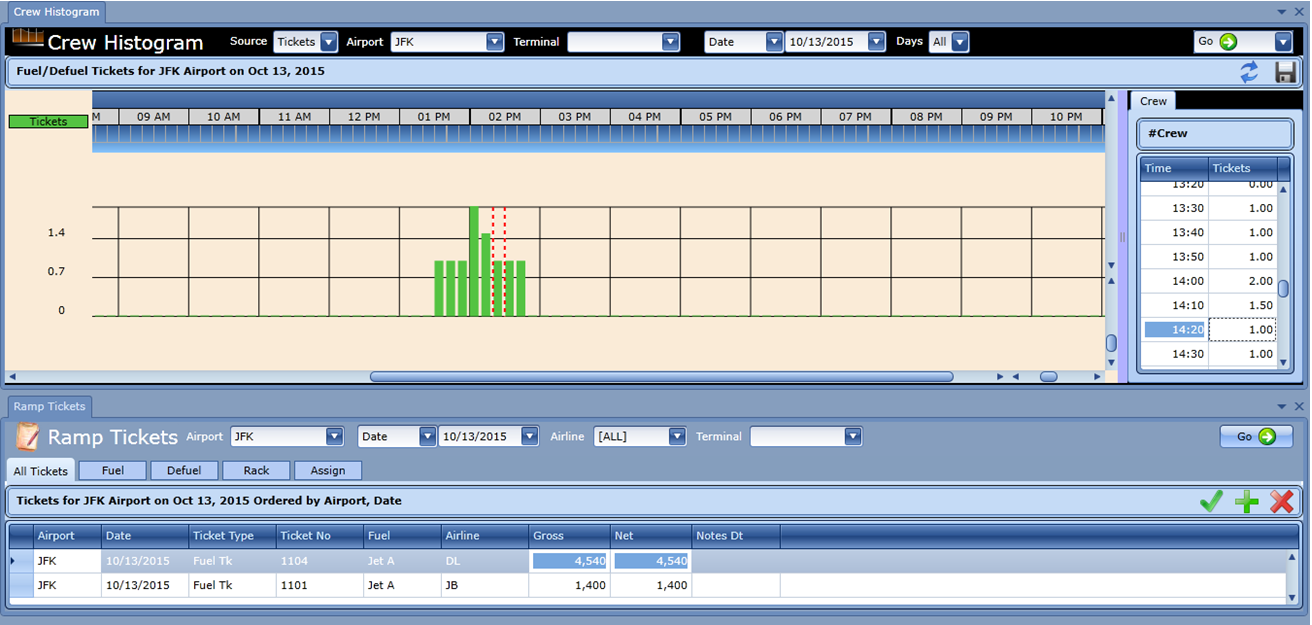
The form is accessed from the Dispatch | Crew Histogram menu and is composed of the Scope Bar, Navigation Bar and two resizable windows: the Histogram Window and the Grid Window.